
Stalling
- Thread starter Mark Zimmerman
- Start date
You are using an out of date browser and will experience issues on R3Owners.Net. Click Here to see options.
Is this something you could say how? I see where I can share the log. Do I send it somewhere 1st? Sorry. Not much tech. Knowledge.Use a spreadsheet or just notepad, spreadsheet is easier. csv is a standard format (Comma Separated Values) that is recognized by most spreadsheets. Like Microsoft Excel or OpenOffice Calc or LibreOffice Calc
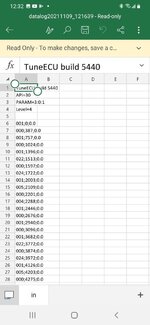
Update: I added Microsoft excel app to phone, opened, went to the .csv file and opened. Looks the same. What went wrong?
Attachments
Last edited:
EskimoPie
Supercharged
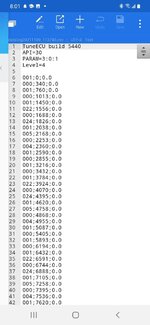
What your screen shot shows is a recording of 3 pieces of data. What you're seeing is a header at the top of the file (rows 1-4) that give some details about the log, and then the data starts at row 6 and each subsequent row is one recording of the sensor data from the OBD2 system. Even though the file is a .CSV (Comma Separated Values), your file is separated by semi-colons. Excel has a feature to automatically split out data like this into individual columns (not sure if the mobile Excel app can do that though). The graphs that you'd posted before seemed to show 5 or 6 variables being graphed, but your CSV file seems to only show 3 (perhaps you didn't have all of them checked for logging as I described earlier). As you scroll through the file is it always just 3 values separated by semi-colons or do the other values start to show up later in the file? Odd that they aren't time-stamped either, I'd expect a data log to have each measurement with a time stamp on it.
I"m not convinced TuneECU is the best tool to be doing this troubleshooting with. It's a programming tool. Even though it has the feature for data logging, it doesn't appear to be very well implemented. There are other android apps that can read your OBD2 data that may be better suited to collecting data like this (Torque is one that's highly regarded, although I don't have any direct experience with using it for this purpose).
You can probably attach the CSV file to this thread so we can take a look at it.
Tripps
Retired superhero
- Joined
- Oct 9, 2010
- Messages
- 11,466
- Location
- Florida and NY
- Ride
- R3T,Sprintona,K1200GT, Blackbird,r/65 hack
Chinese calculus, eh?
Thanks for trying to help!What your screen shot shows is a recording of 3 pieces of data. What you're seeing is a header at the top of the file (rows 1-4) that give some details about the log, and then the data starts at row 6 and each subsequent row is one recording of the sensor data from the OBD2 system. Even though the file is a .CSV (Comma Separated Values), your file is separated by semi-colons. Excel has a feature to automatically split out data like this into individual columns (not sure if the mobile Excel app can do that though). The graphs that you'd posted before seemed to show 5 or 6 variables being graphed, but your CSV file seems to only show 3 (perhaps you didn't have all of them checked for logging as I described earlier). As you scroll through the file is it always just 3 values separated by semi-colons or do the other values start to show up later in the file? Odd that they aren't time-stamped either, I'd expect a data log to have each measurement with a time stamp on it.
I"m not convinced TuneECU is the best tool to be doing this troubleshooting with. It's a programming tool. Even though it has the feature for data logging, it doesn't appear to be very well implemented. There are other android apps that can read your OBD2 data that may be better suited to collecting data like this (Torque is one that's highly regarded, although I don't have any direct experience with using it for this purpose).
You can probably attach the CSV file to this thread so we can take a look at it.
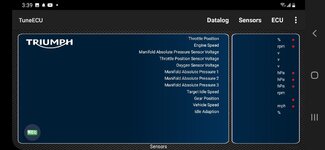
No, I had I think 7 selections to record as screen shot below shows.
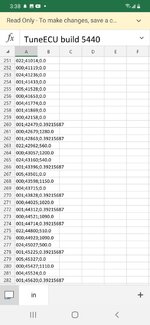
There are more numbers shown at about #260.
Herman has an idea that may be of use he will share Saturday.
Attachments
EskimoPie
Supercharged
Even though there are more numbers after line 260, it's still just 3 pieces of data (3 unique values separated by semi-colons). You're just going from a 0.0 value to a value with more digits so it looks longer.
No idea why only recorded 3 when 7 selected and 7 reds dots showing like it should.Even though there are more numbers after line 260, it's still just 3 pieces of data (3 unique values separated by semi-colons). You're just going from a 0.0 value to a value with more digits so it looks longer.
TURBO200R4
stand up straight and grab the world by the a$$
No idea why only recorded 3 when 7 selected and 7 reds dots showing like it should.
the three recorded events stored in the data logs is what Tyler is talking about not the item you selected to record.
when you open up one of the events you recorded/captured in data logs then u should be able to tap green arrow and watch it play .
you also have a plus that you can tap to make the recording bigger.
there is a cursor line that u can move to mark the area you want to view and it may do more maybe give the exact figures.
hth
