
Kevin frazier
Widowmaker!
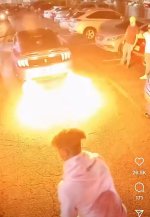
No dynos? 20 thousand dollar bikes deserve to be dynoed,  . Its a good thing we got Penner. @Nashvegas show us what your tune looks like, post your dyno for a look at that fire breathing dragon you got. Them pipes are nasty! Fireworks show at nighttime for sure.
. Its a good thing we got Penner. @Nashvegas show us what your tune looks like, post your dyno for a look at that fire breathing dragon you got. Them pipes are nasty! Fireworks show at nighttime for sure.Attachments
Last edited:

